PRISMA Flow Diagram Explained: A Practical Guide for Systematic Reviews
— Gatsbi
Executive Summary: The PRISMA (Preferred Reporting Items for Systematic Reviews and Meta-Analyses) flow diagram is a four-phase chart that transparently maps how studies are identified, screened, and included in a systematic review. This guide explains PRISMA’s history (2009 origin, 2020 update) and purpose (standardizing SR reporting), and walks through each box and arrow in the flow diagram. We compare the PRISMA 2009 and 2020 flow diagrams in a table, highlight common mistakes (e.g. omitting “other sources” counts), and share practical tips (like using the official Word templates or Shiny app). Examples from published reviews illustrate best practice.
What is PRISMA? (History and Purpose)
PRISMA stands for Preferred Reporting Items for Systematic reviews and Meta-Analyses. It originated in 2009 to improve the transparency and completeness of published systematic reviews. The original PRISMA (2009) gave authors a 27-item checklist and a four-phase flow diagram (identification, screening, eligibility, included). In 2020, an international group of 26 experts updated the guidelines (PRISMA 2020) to reflect advances in evidence synthesis. Key changes include more detailed reporting of search strategies (for all databases, registries, websites), mandatory listing of excluded studies with reasons, and clearer differentiation of studies versus reports. PRISMA 2020 also introduced multiple flow-diagram templates (for new vs updated reviews, and inclusion of non-database sources), making the flow chart more flexible. Importantly, PRISMA (including flow diagrams) is open-access under CC BY 4.0, so no permissions are needed to use or adapt it.
The PRISMA Flow Diagram: Phases and Boxes
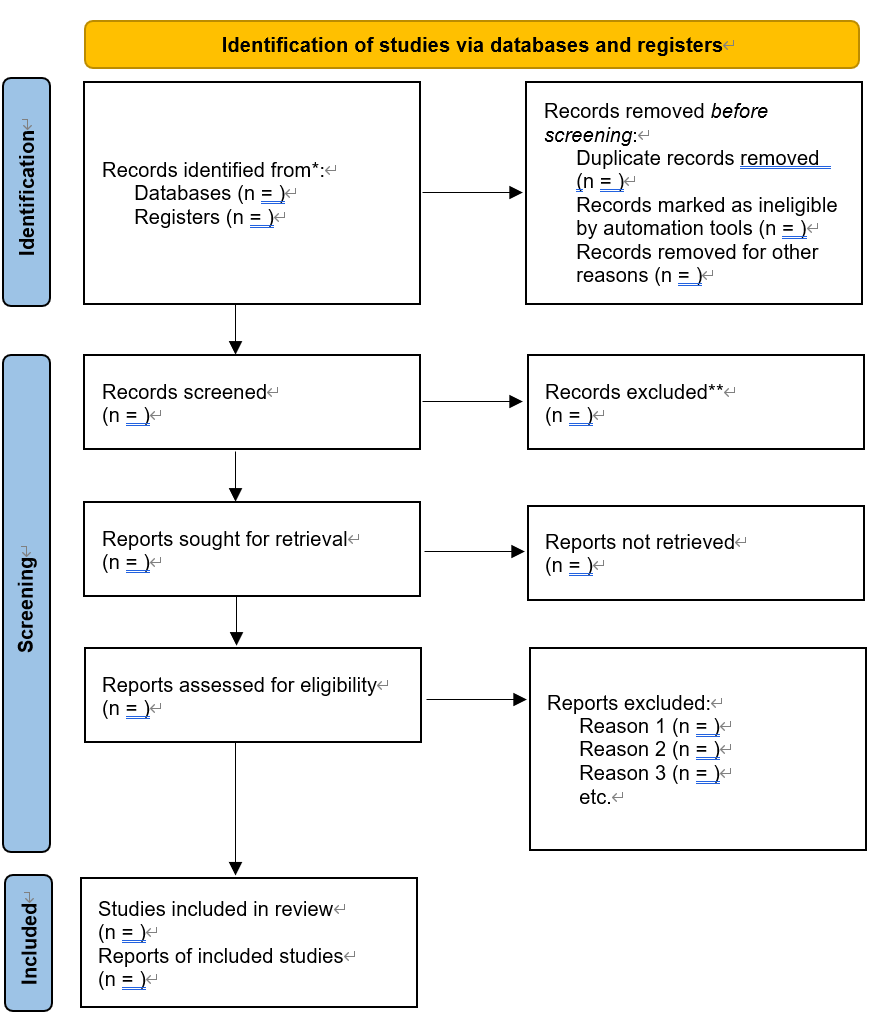
The PRISMA flow diagram graphically reports how many records were processed at each review stage. Column 1 (“Databases and registers”) shows results from formal searches (bibliographic databases, trial registries), while Column 2 (“Other sources”) covers records from nontraditional searches (websites, reference lists, citation searches, etc.). The main sections are:
- Identification (Records identified): Numbers of records found through each source. In PRISMA 2020, you should report the count from each database and registry, and also from each other source. For example, Thompson et al. identified 112 records via 5 databases and 4 from “other sources”. The diagram first shows the total records identified, then the number remaining after duplicates are removed.
- Screening: After removing duplicates, the remaining records are screened (usually by title/abstract). The diagram records how many were excluded at screening, along with reasons if space permits. The difference between “Records screened” and “Records excluded” goes to “Reports sought for retrieval.”
- Eligibility (Reports assessed): The number of full-text reports (articles) obtained and assessed. From these, reviewers note how many full texts were excluded with reasons (e.g. wrong population or design). The PRISMA 2020 flow adds a new “Reports not retrieved” box for any inaccessible papers.
- Included (Studies/reports): Finally, PRISMA shows how many studies and reports of studies were included. A study may have multiple reports. PRISMA 2020 explicitly separates “Studies included” and “Reports of included studies,” addressing issues where one study yields several reports. For example, if two articles report follow-up of the same trial, that counts as 1 study, 2 reports included.
The diagram uses downward arrows to show flow. Arrows lead from identification to screening to eligibility to included. Some arrows skip sections when appropriate (e.g. other-sources records may feed directly to included if already screened).
Differences: PRISMA 2009 vs PRISMA 2020
| Aspect | PRISMA 2009 flow diagram | PRISMA 2020 flow diagram |
|---|---|---|
| Sections | 4 phases: Identification, Screening, Eligibility, Included | Similar phases, but Identification split into Databases/Registers and Other sources columns. |
| Columns | Single track | Two parallel tracks: Column 1 (Databases & Registers) and Column 2 (Other sources). |
| Records from sources | “Other sources” box often only included included studies (a common mistake). No explicit place for registries. | Expected to list counts from each database and each other source. Now clearly tracks all records from websites, reference lists, etc. |
| Citation searches | Handled informally (could be in other sources) | “Citation searching” can be reported in either column, but PRISMA 2020 suggests including it in Column 2 (other methods) or Column 1 if treated as database searches. |
| Updates & Registries | No special provision (just counts in identification) | Separate templates for updated reviews (tracking previous included studies) and for including trial registries. |
| Studies vs Reports | Only “studies included” | Adds a “Reports of included studies” box to capture if multiple reports per study. |
| License | Not explicitly stated in paper | CC BY 4.0 – diagrams and templates are free to use or adapt. |
The table highlights major updates. For example, under PRISMA 2009 one might only list the number of relevant studies from “other sources,” obscuring the true search yield. In contrast, PRISMA 2020 insists on reporting total records identified per source, making the search strategy fully transparent. Both versions flow similarly from identifying records to screening to final inclusions, but the 2020 version is more granular (as shown above).
Step-by-Step Walkthrough of the PRISMA Flow
- Identify all records: Run your search in each database and registry. Enter the total number of records found for each (PRISMA 2020). Also tally records from other strategies (Grey literature, reference mining, etc.). Tip: Use a reference manager or spreadsheet to track duplicates and sources.
Example: In a trial review, one study found 6,444 records from databases. - Remove duplicates: Subtract any records found in multiple sources. Enter the count removed. The remaining “Records after duplicates” is what you screen.
Common mistake: Forgetting to list the number of duplicates removed. PRISMA 2020 flow has a box for this. - Screen titles/abstracts: From the deduplicated list, note how many records were screened and how many were excluded at this stage (with brief reasons or just count).
Tip: Use bullet points for common exclusion reasons in methods, even if not in the diagram. - Retrieve full texts: Enter “Reports sought for retrieval” = number of full-text articles obtained. If some full texts could not be found, record those under “Reports not retrieved” (an addition in PRISMA 2020). For example, 52 full-text reports may have been assessed with zero not retrieved.
Tip: Before declaring a report “not retrievable,” exhaust options (library loans, contacting authors). - Assess eligibility: Count the reports assessed for inclusion. Then subtract “Reports excluded” (with reasons). List exclusion reasons in methods or append them on the diagram. Common reasons: wrong population, irrelevant outcomes, etc.
Mini-case: Thompson et al. found 28 full-text articles, excluded 15 (e.g. wrong design or language), and included 13 studies. - Include studies: Finally, report how many unique studies were included and how many reports. If one study appears in multiple papers, use PRISMA’s two boxes. In [26], Rethlefsen explains that 8 studies might appear in 10 reports; PRISMA 2020 would list “Studies included = 8” and “Reports of included studies = 10”. This avoids “losing” reports between the numbers assessed and included.
Figure: A generic PRISMA flow diagram (SVG). This flowchart (clickable image) illustrates the four sections (Identification, Screening, Eligibility, Included) and shows the two columns for database searches versus other sources in PRISMA 2020. It is derived from PRISMA’s CC-licensed template.
Common Mistakes and Pitfalls
- Not counting all “other sources”: Under PRISMA 2009, many authors only filled in the “additional records” box with included articles, not all ones found. PRISMA 2020 corrects this by emphasizing that all records from non-database sources should be tallied. Always track citations from reference lists, websites, contacts, etc. If you can’t feasibly count them all, report what you can and list in supplements.
- Misplacing citation searches: The flow template labels “citation searching” under Column 2, but citation databases (like Web of Science) are also databases. Rethlefsen and Page advise you could place them in Column 1 if you choose. The key is consistency. In any case, list how many records citation searches yielded in supplements.
- Overcounting Google results: Google Scholar and Google can show >10,000 hits, but only the first 1,000 are retrievable. Never list more than 1,000 per search. Many teams decide beforehand to screen only a sample (e.g. top 500), and should report that number.
- Confusing studies vs. reports: Without the PRISMA 2020 separation, some flows “lost” reports. Always double-check: if you assessed 50 reports and included 8 studies, but you know 2 studies had 2 reports each, you should show “Studies = 8” and “Reports = 10” to account for all.
- Forgetting updates: If you rerun searches (e.g. before publication), PRISMA-S says treat each search as one data point. In the flow diagram, combine them per database (e.g. “Databases (original + update): N total”) and mention in supplements.
Practical Tips for Creating Your PRISMA Diagram
- Use official templates or tools: The PRISMA website offers Word templates for each review type. Alternatively, the PRISMA2020 R package or ShinyApp can auto-generate SVG/PNG diagrams from your data. These ensure you don’t miss a box.
- Customize if needed: The Word versions are modifiable. If you have extra categories (e.g. three separate registries), you can add rows or footnotes. Credit PRISMA 2020 (CC BY) in your caption. No permission needed as long as you cite it.
- Detail in supplements: Even if the flow chart shows totals, supplement tables should list how many records each database and source produced (PRISMA-S recommendation). For transparency, attach search logs or strategy screenshots in an appendix.
- Report excluded studies: Besides reasons in the flow, consider a reference list of excluded studies that “almost” qualified (PRISMA item 7c). Many journals encourage a citation list of these to improve transparency.
- Localization: For Chinese and other audiences, note that PRISMA has been translated (e.g. PRISMA 2009 and 2020 in Chinese) and extended (PRISMA-CHM for herbal medicine). When writing for Chinese journals, use the term “PRISMA流程图” and ensure full translated citation of PRISMA papers.
Key Takeaways
- The PRISMA flow diagram is essential for transparent SR reporting, showing how many records moved through identification, screening, eligibility, and inclusion.
- PRISMA 2020 updated the diagram to clarify searches from multiple sources and to differentiate studies vs reports.
- Use the official templates (Word or Shiny) and follow PRISMA‐S advice to track each information source.
- Common pitfalls include undercounting non-database records and forgetting to log updates. The JMLA guidelines answer many FAQs.
- For Chinese readers: PRISMA has Chinese translations and even specialty extensions (e.g. for herbal medicine). Including the PRISMA diagram (in English or 中文) strengthens any SR report.